


About Us
Executive Editor:Publishing house "Academy of Natural History"
Editorial Board:
Asgarov S. (Azerbaijan), Alakbarov M. (Azerbaijan), Aliev Z. (Azerbaijan), Babayev N. (Uzbekistan), Chiladze G. (Georgia), Datskovsky I. (Israel), Garbuz I. (Moldova), Gleizer S. (Germany), Ershina A. (Kazakhstan), Kobzev D. (Switzerland), Kohl O. (Germany), Ktshanyan M. (Armenia), Lande D. (Ukraine), Ledvanov M. (Russia), Makats V. (Ukraine), Miletic L. (Serbia), Moskovkin V. (Ukraine), Murzagaliyeva A. (Kazakhstan), Novikov A. (Ukraine), Rahimov R. (Uzbekistan), Romanchuk A. (Ukraine), Shamshiev B. (Kyrgyzstan), Usheva M. (Bulgaria), Vasileva M. (Bulgar).


Phisics and Mathematics
 PDF
PDFAbstract
In work [1] the mathematical model of spread of tuberculosis is offered. In the proposed work, the system of equations is determined numerically, the mathematical model is visualized, and the parameters of the model are changed in the range.
Keywords: mathematical model, program realization, visualization, tuberculosis, population.
1 INTRODUCTION
The increase in respiratory morbidity among the population requires a constant monitoring and long-term forecasting. Analysis of statistic data is non-effective, because patients are primarily tracked in the "sight area" of health facilities. At present the most promising is method is the mathematical model of the spread and control of tuberculosis. This the mathematical model allows for the prediction of the situation in populations with the use of anti-tuberculosis programs, compare of the effectiveness of these programs and the task of choosing the best anti-tuberculosis programs in the effective fight against the increase in morbidity.
That’s way, it is necessary to carry out a numerical solution to the system of mathematical model equations with arbitrary parameter values.
In this work a visual model of the spread of TB has been developed that allows different model parameters to be changed within a given range. The trend of changing different populations is represented in the graphical execution.
2 MATHEMATICAL MODEL
The size of the model groups submits to system of non-linear ordinary the differential equations (1) - (6), principle of the build int [1]. The parameters used in equations (1) - (6) are presented in table 1, block diagram are shown in Figure 1.
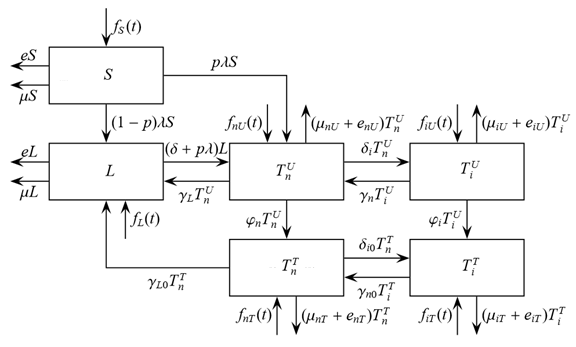
Figure 1. Block-diagram of the model (1) – (6).
|
|
(1) |
|
|
(2) |
|
|
(3) |
|
|
(4) |
|
|
(5) |
|
|
(6) |
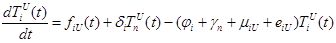
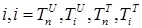
where the total populations is divided into 6 groups: S(t) is no infected; L(t) is infected (latent infection carriers);  is unidentified without bacteria;
  is unidentified with bacteria;
  is identified without bacteria;
  is identified with bacteria;
Table 1. Coefficients and values of basic model
|
Symbol |
Description |
|
fi(t,...) |
Speed of migration flow to group |
|
Λ |
The power of infection |
|
µ |
populations death for group S and L |
|
µnU |
Mortality in group unidentified ( |
|
µiT |
Mortality in group unidentified ( |
|
µnT |
Mortality in group identified ( |
|
µiT |
Mortality in group identified ( |
|
e |
Factor for outflow migration from groups S and L |
|
ei |
Factor for outflow migration from groups of patients |
|
p |
Probability of rapid progression disease |
|
δ |
Endogenous activation factor |
|
δi |
Infectious disease development Rate |
|
γL |
Spontaneous pull factor |
|
γn |
Coefficient of spontaneous termination of bacteria |
|
Φi |
Rate of identification of patients with bacteria |
|
Φn |
Rate of identification of patients without bacteria |
|
δi0 |
Infectious disease rate in the background of treatment |
|
γL0 |
Clinical retrieval Rate |
|
γn0 |
Rate of termination of bacteria in the treatment |
 includes inflows of youth
 )
)
 )
)
 )
)
 )
)
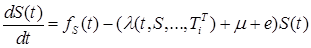
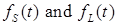
3 Program realization of the Tuberculosis Model
Systems of equations (1)-(6) have been numerically resolved. As a result, for a mathematical model an interface was created:
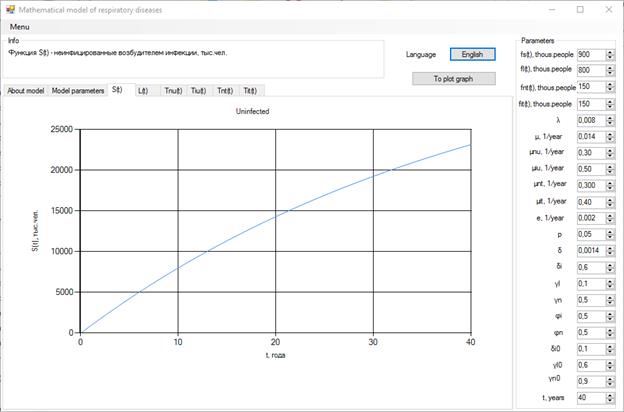
Figure 2. Visualization of the Model
A graphical interpretation of the mathematical simulation results can be used to track changes in the number of different population groups.
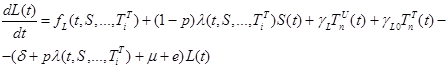
The increase in the number of patients in the group identified without bacteria may be caused by an increase of δi, δi0, γL0 and a decrease of µnT, Φi, γn0 (Figure 3).
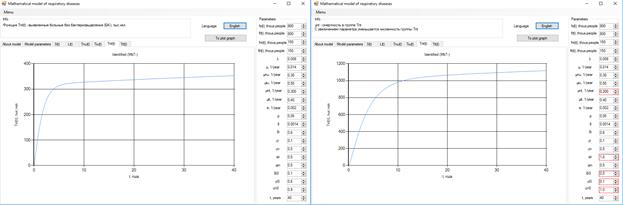
Figure 3. Increase in the number of patients without bacteria.
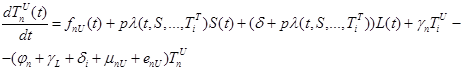
After 10 years, the number of bacteria patients will grow to 140 thousand, with a reduction of the coefficient µiT (Figure 4).
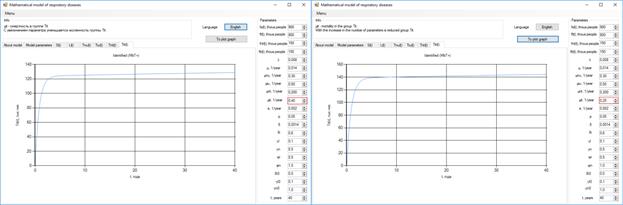
Figure 4. Increase in the number of patients with bacteria.
Increasing the probability of a rapid progression disease (p) will lead to an increase in the infected population (, , , ) (Figure 5 - 8).
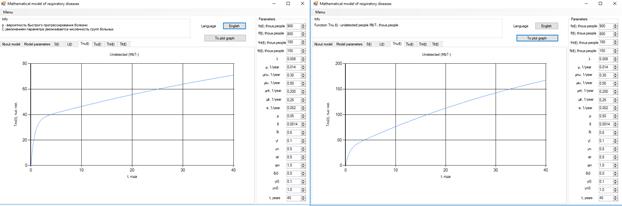
Figure 5 . Increase in the number of patients in the group .
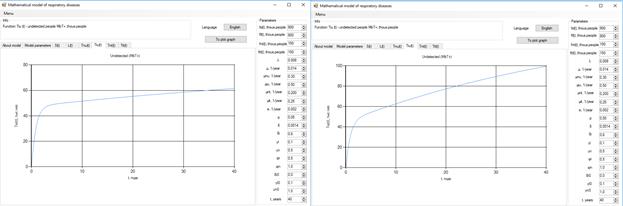
Figure 6 . Increase in the number of patients in the group .
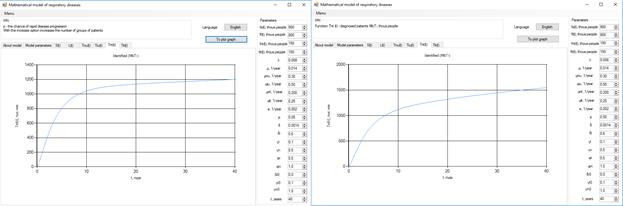
Figure 7. Increase in the number of patients in the group .
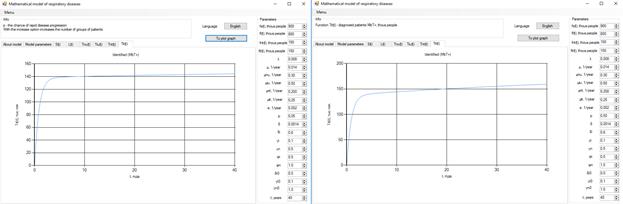
Figure 8 . Increase in the number of patients in the group .
Conclusion
The application of a mathematical model allows predict the development of Tuberculosis and it is feasible to track the number of groups of nonidentified patients. The graphical representation of the results allows visually track size group and quick change the parameters of the model allows select effective anti-tuberculosis programs.
Izhutkin V., Zonov A. RESEARCH OF THE MATHEMATICAL MODEL FOR THE SPREAD AND CONTROL OF TUBERCULOSIS. International Journal Of Applied And Fundamental Research. – 2017. – № 3 –
URL: www.science-sd.com/471-25363 (25.03.2026).