


About Us
Executive Editor:Publishing house "Academy of Natural History"
Editorial Board:
Asgarov S. (Azerbaijan), Alakbarov M. (Azerbaijan), Aliev Z. (Azerbaijan), Babayev N. (Uzbekistan), Chiladze G. (Georgia), Datskovsky I. (Israel), Garbuz I. (Moldova), Gleizer S. (Germany), Ershina A. (Kazakhstan), Kobzev D. (Switzerland), Kohl O. (Germany), Ktshanyan M. (Armenia), Lande D. (Ukraine), Ledvanov M. (Russia), Makats V. (Ukraine), Miletic L. (Serbia), Moskovkin V. (Ukraine), Murzagaliyeva A. (Kazakhstan), Novikov A. (Ukraine), Rahimov R. (Uzbekistan), Romanchuk A. (Ukraine), Shamshiev B. (Kyrgyzstan), Usheva M. (Bulgaria), Vasileva M. (Bulgar).


Materials of the conference "EDUCATION AND SCIENCE WITHOUT BORDERS"
 PDF
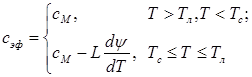
PDFTo develop modes of billets cooling at continuous steel casting mathematical models of billets hardening and cooling are widely used. To account latent heat of phase and structural transformations in these models an effective heat capacity coefficient is applied [1].The type of effective heat capacity function is known for steel with the carbon content from 0.5% to 2.14% and depends on assumptions concerning carbon diffusion process in solid and liquid phases at crystallization of a two-phase zone billets. For equilibrium crystallization conditions, under which the carbon diffusion goes on easily and a coefficient of the separation diffusion on the boundary of solid and liquid phases is taken as constant and different from zero value, this function is given by following [1]:
 (1)
(1)
where сМ – heat capacity [J/(kg×K)]; Тл, Тс – the start and the end temperature of the alloy crystallization; L – specific heat of crystallization [J/kg]; ![]() – the rate of binary alloy crystallization under equilibrium conditions [1/K].
– the rate of binary alloy crystallization under equilibrium conditions [1/K].
In the process of hardening and cooling of steels with carbon content less than 0.5% there could be phase (“liquid phase – ferrite”, “liquid phase – austenite”) and structural (“ferrite – austenite”) transformations, which create diverse heat effects. Therefore, application of the formula (1) for such alloys is impossible. On the given fragment of Fe-C linearized diagram you can see that, depending on initial concentration of carbon C, the process of alloy crystallization will go in different ways. Therefore, steels with carbon concentration less than 0.5% can be divided into two groups: I – С ≤ 0.1%; II – 0.1% < С ≤ 0.16%; III – 0.16% < C ≤ 0.5%.
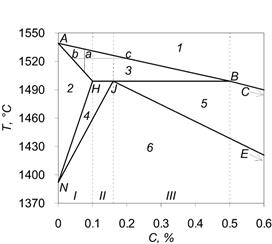
Figure 1 – The fragment of linearized diagram Fe-C: 1 – liquid phase; 2 – ferrite; 3 – liquid phase + ferrite; 4 – ferrite + austenite; 5 – liquid phase + austenite; 6 - austenite
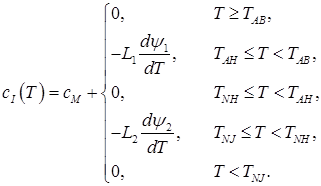
On the basis of the represented diagram, formulas for the calculation of effective heat capacity, which take account for all the phase and structural transformations occurring during the steel crystallization in temperature range, specific for continuous steel teeming, were deduced. These are the formulas for each group of steels, specified on Figure 1:
I. С ≤ 0.1%
 (2)
(2)
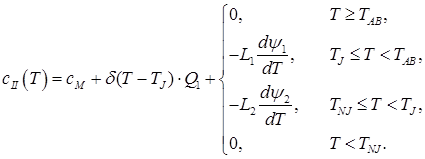
II. 0.1% < C ≤ 0.16%
 (3)
(3)
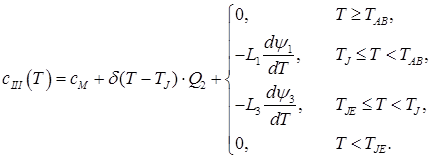
III. 0.16% < C ≤ 0.5%
 (4)
(4)
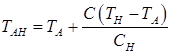
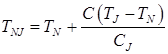
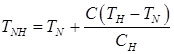
In the given ratios L1 – transformation heat “liquid phase – ferrite”; L2 – transformation heat “ferrite – austenite”; L3 – transformation heat “liquid phase – austenite”; δ(T) – Dirac delta function; ψ1 – ferrite ratio in the solution “liquid phase + ferrite”; ψ2 – austenite ratio in the solution “ferrite + austenite”; ψ3 – austenite ratio in the solution “liquid phase + austenite”; TAB, TAH – start and end temperatures of conversion “liquid phase – ferrite”; TNJ, TNH – start and end temperatures of conversion “ferrite – austenite”; TJE, – end temperature of conversion “liquid phase – austenite”;
Values ψ1, ψ2, ψ3 are calculated according to following formulas (with regard to ![]() ):
):
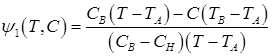 (5)
(5)
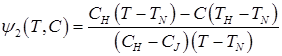 (6)
(6)
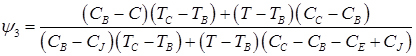 (7)
(7)
Temperatures TAB, TAH, TNJ, TNH, TJE, depending on the carbon content in the steel, are calculated on formulas:
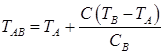 ; (8)
; (8)
 ; (9)
; (9)
 ; (10)
 ; (11)
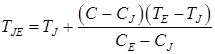 (12)
(12)
Values of critical points, shown in Figure 1 and used in the formulas (2) – (12), listed in Table 1.
Table 1
The values of temperature and carbon content for the points in the diagram Fe-C
|
Point |
Temperature, °С |
Carbon concentration, % |
|
A |
1539 |
0 |
|
B |
1499 |
0.5 |
|
C |
1147 |
4.3 |
|
E |
1147 |
2.14 |
|
J |
1499 |
0.16 |
|
H |
1499 |
0.1 |
|
N |
1392 |
0 |
Dependency diagrams of coefficient of effective heat capacity (2), (3) and (4) shown in Figure 2. In the calculations, Dirac delta function was approximated by the formula:
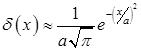 ,
,
where a – empirical coefficient.
In this case we adopt the convention that cM=690 J/(kg×K), L1=275000 J/kg [2], L2=21000 J/kg [2], a=0.75. The heat value of the peritectic transformation isn’t found in scientific and technical literature, so the LП value was determined from the literature [3], [4], from the experimental data on the amount of the heat, released during the crystallization process of steels with carbon content less than 0.5%. Deduced value is LП=86000 J/kg.
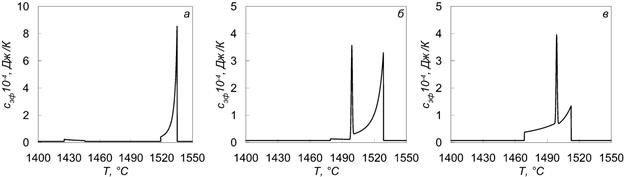
Figure 2 – Dependence of the effective heat capacity of the steel from the temperature at various carbon content: а – С = 0.05%; б – С = 0.13%; в – С = 0.33%.
As follows from Figure 2, the nature of the coefficient curve of effective heat capacity depends heavily on initial carbon concentration in the steel.
To analyze the process of hardening and cooling of steels with carbon content less than 0.5% the sample hardening in the form of thermally thin body with thickness 2S, which is cooled at a given heat-transfer rate q on the surface, is considered. In this case, the hardening process is described by the following equation:
![]() (22)
(22)
where cef is defined by the formulas (14), (16) or (21) depending on initial concentration of carbon; r – density.
At the initial time ![]()
The solution of this equation is obtained by the method of finite differences:
 (23)
(23)
Calculation by formula (23) was carried out at the following initials: S = 1 mm, T0 = 1550°C, r = 7300 kg/m3, q = 1.0 MW. As an example here was taken the process of hardening of steels, belonging to each of the groups considered in this study: C = 0.05%, 0.13%, 0.33%.
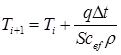
Results of the hardening dynamics research are shown in Figure 3 as curves of effective value of heat capacity changes and cooling in the cooling process.
Figure 3 – Curves of effective heat capacity changes (···) and cooling (—) of steels with various carbon content: а – С = 0.05%; б – С = 0.13%; в – С = 0.33%
As follows from Figure 3, the nature of the cooling curve is intimately related to coefficient changes of effective heat capacity.
As a result of research, graphic features of dependence of an effective heat capacity from temperature of steel brands of three groups are received. In addition, there is a close connection between the coefficient of effective heat capacity and cooling curves, which must be considered when modeling hardening of the steel with carbon content of 0% < C ≤ 0.5%.
2. V.K. Grigorovich, Electronic structure and thermodynemics of iron alloys. – Publishin hous “Nauka”, 1970, p 292
3. Yu.A. Nekhendzi, Casting properties of alloys. – Casting properties of metals and alloys. Proceedings of the 11th meeting,1966, p 23
4. V.A. Zhuravlev, Ye.M.Kitaev, Thermal physics of the continuous ingot formation. – M: “Metallurgy”, 1974, p 216.
5. V.M. Golod, K.M. Emelyanov, Computer analysis of the kinetics and completeness of the peritectic transformation – Scientific and technical reports of Saint Petersburg State Polytechnical University. Science and Education, №2, 2011, p 206 – 211
Kabakov Z.K., Pavzderin A.I., Kozlov G.S. RESEARCH OF STEEL HARDENING DYNEMICS OF Fe-C SYSTEM AT 0% < C ≤ 0.5%
. International Journal Of Applied And Fundamental Research. – 2013. – № 2 –
URL: www.science-sd.com/455-24445 (22.07.2026).