


About Us
Executive Editor:Publishing house "Academy of Natural History"
Editorial Board:
Asgarov S. (Azerbaijan), Alakbarov M. (Azerbaijan), Aliev Z. (Azerbaijan), Babayev N. (Uzbekistan), Chiladze G. (Georgia), Datskovsky I. (Israel), Garbuz I. (Moldova), Gleizer S. (Germany), Ershina A. (Kazakhstan), Kobzev D. (Switzerland), Kohl O. (Germany), Ktshanyan M. (Armenia), Lande D. (Ukraine), Ledvanov M. (Russia), Makats V. (Ukraine), Miletic L. (Serbia), Moskovkin V. (Ukraine), Murzagaliyeva A. (Kazakhstan), Novikov A. (Ukraine), Rahimov R. (Uzbekistan), Romanchuk A. (Ukraine), Shamshiev B. (Kyrgyzstan), Usheva M. (Bulgaria), Vasileva M. (Bulgar).


Materials of the conference "EDUCATION AND SCIENCE WITHOUT BORDERS"
 PDF
PDFEffective engineering and safe use maintenance of various technical objects require precise knowledge of the materials’ fatigue resistance figures in order to set permissible operating loads and to estimate the remaining assets correctly. At the same time high sensitivity of the fatigue resistance figures to current factors, one of which we consider to be repeated loading frequency (ω), makes the set aim of forecasting the materials’ behavior at repeated loading considerably more complicated, then, for instance, in case of constant loading action.
By the figures of fatigue resistance we understand the slope of left branch of fatigue curve (tgαw) and quantitative value of materials surface damaging.(Ф)
In a number of cases the frequency of repeated loading (ω) considerably influences the fatigue resistance figures [1-2]. It is established, that frequency increase of repeated loadings as well as mitigation of stress state scheme (revolving specimen curve deformation) leads to substantial reduction of left branch inclination of fatigue curve (figure tgαw), id est to advance of fatigue resistance. The advance of fatigue resistance figures (tgαw) is connected with increase in lasting quality of the surface layers of specimen (parts), which reduce fatigue damaging of the surface proper (Ф).
The research conducted allowed to obtain new characteristics, defining lasting quality and durability of the specimen (parts). Experimental data were processed so, that when ω = const, the average figure tgαw was defined, then the relations tgαw =f(ω) were created. Computer processing of data showed, that the first group data can be arranged as a straight line (pic.1, a), and the second group data can be arranged as a sort of a curve (pic. 1, b)
а) 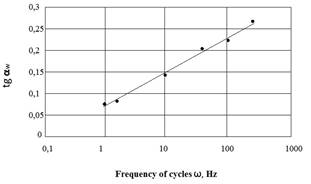 b)
b) 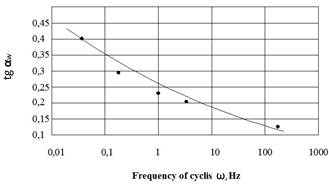
Pic. 1. Relation of fatigue resistance figures tgαw to repeated loading frequency (ω): a- first group of materials, b – second group of materials
In the first case we can see reduction of fatigue resistance with increase in figure ω, in the second – we see the advance of fatigue resistance. However, we need to consider, that the figure tgαw is directly connected to the surface damaging (Ф), and in both groups of fine metals we see that the increase of figure (Ф) causes increase of tgαw [1-2]. We have obtained mathematical relation of the following type:
tg αw=0,0356 ln ω + 0,065 referring to the first group of materials;
tg αw=0,262 ω-0,1301 referring to the second group of materials.
Basing
on the obtained experimental data we have developed the method of forecasting
lasting quality and durability of constructional materials. With a knowledge of
the repeated loading frequency , as in pic.1 we can define the fatigue
resistance figure tg
αw
. As a result we obtain two figures of the parameter tg αw for the 1st
and the 2nd group of materials. Using the figure tg αw and the relation of
this figure to the parameter χ, relation to be
obtained from the experimental research, we take down two figures of the
parameter ![]() , where
, where![]() – is stress,
corresponding to the durability N=106 of cycles. The data to single
tearing of specimen allow to know the durability point (σв)
and to precise the figures χ and
– is stress,
corresponding to the durability N=106 of cycles. The data to single
tearing of specimen allow to know the durability point (σв)
and to precise the figures χ and ![]() . Using the graphical
relations tgαw –
. Using the graphical
relations tgαw – ![]() we can create the left
branch of the forecasted curve of fatigue. Further, using the research paper,
we find the bending point of the forecasted curve of fatigue [1].
we can create the left
branch of the forecasted curve of fatigue. Further, using the research paper,
we find the bending point of the forecasted curve of fatigue [1].
Consequently, we obtain an express-method of accelerated creation of the constructional material specimen fatigue curve, when there is a knowledge of the repeated loading frequency figure (ω) and material durability point (σв). In this manner we can forecast the fatigue curve of a required part and thus considerably save time and cost of their production, the most important parts to be tested considering this forecast.
2. Myl'nikov V.V., Shetulov D.I., Chernyshov E.A. Investigation into the Surface Damage of Pure Metals Allowing for the Cyclic Loading Frequency // Russian Journal of Non Ferrous Metals, 2013, Vol. 54, No. 3, pp. 229–233.
Mylnikov V.V. ACCELERATED METHOD TO FORCAST THE PARAMETERS OF METAL MATERIALS FATIGUE RESISTANCE WITH CONSIDERATION OF REPEATED LOADING FREQUENCY. International Journal Of Applied And Fundamental Research. – 2013. – № 2 –
URL: www.science-sd.com/455-24311 (22.07.2026).