


About Us
Executive Editor:Publishing house "Academy of Natural History"
Editorial Board:
Asgarov S. (Azerbaijan), Alakbarov M. (Azerbaijan), Aliev Z. (Azerbaijan), Babayev N. (Uzbekistan), Chiladze G. (Georgia), Datskovsky I. (Israel), Garbuz I. (Moldova), Gleizer S. (Germany), Ershina A. (Kazakhstan), Kobzev D. (Switzerland), Kohl O. (Germany), Ktshanyan M. (Armenia), Lande D. (Ukraine), Ledvanov M. (Russia), Makats V. (Ukraine), Miletic L. (Serbia), Moskovkin V. (Ukraine), Murzagaliyeva A. (Kazakhstan), Novikov A. (Ukraine), Rahimov R. (Uzbekistan), Romanchuk A. (Ukraine), Shamshiev B. (Kyrgyzstan), Usheva M. (Bulgaria), Vasileva M. (Bulgar).


Medical sciences
 PDF
PDFIntroduction
Peripheral nervous system lesions cause muscle weakness and atrophy, sensory deficits, decreased tendon reflexes, and failure. Electrophysiologic evaluations such as electroneurography and electromyography (EMG) аге routine investigations to determine the site and degree of muscle lesions. Cerebrospinal fluid analysis, conventional radiography, computed tomography (CT), and magnetic resonance imaging (MRI) demonstrate pathophysiologic changes, e.g., herniation of intervertebral disks or turners affecting peripheral nerves. Diagnostic ultrasound has been used in muscle imaging for more than a decade and has been acknowledged as particularly valuable for identifying muscle regions in which inflammation, fat, fibrosis, calcifications, and perivascular changes occur [27]. Correlations among imaging techniques, such as CT, MRI, and ultrasound, have shown good agreement with histopathology and EMG in myopathies [2, 50]. Sipila and Suominen [54, 55] suggest that ultrasound imaging is a reliable method for measuring cross-sectional area and for assessing lean mass, and thus it has application for detection of adaptation to muscle strengthening programs.
Compared with CT and MRI, ultrasound is a considerably less expensive and relatively more portable imaging technique. Ultrasound technology provides quantitative and qualitative information about muscle features that may be linked to measures of muscle strength. Observations of how normal and myopathic muscles differ in cross-sectional diameters during contraction and relaxation and how these differences relate to strength may lead to a better appreciation of the potential of ultrasound imaging in quantifying response to exercise and, conversely, to disuse.
Muscle imaging is not yet routine in the diagnosis of muscle; however, it is valuable in the dеtесtiоn of atrophy and alterations of skeletal muscles [13, 53]. Ultrasonоgгарhу [4, 11, 12, 20], CT [32], and MRI [14, 60] аге useful tools in the depiction of muscle abnormalities due to disuse. Using ultrasonography, Gunreben and Воgdаh [20] did not obtain pathologic findings up to 10 days after injury. Fleckenstein et al. [14] reported MRI to bе unreliable even within the first month after acute denervation. However, was found increased short inversion time inversion recovery signals in denervated muscles as early as 4 days after the onset of clinical symptoms [60]. In EMG, pathologic spontaneous activity can bе detected after а delay of 2 to 3 weeks [31].
Replacement of EMG bу ultrasonography might have benefits. Furthermore, imaging techniques can provide information about muscle status (e.g., lengths and angles of fascicles, and muscle thickness), which is not within the scope of EMG. However, systematic studies mуоsonographic findings in the diagnosis of muscle not yet bееn reported. This prospective study evaluated the diagnostic value of myosonography by of the patients with possible injuries to nerve, and muscle.
A number of studies have documented that the microgravity environment encountered during spaceflight or simulated by using models of weightlessness induces alterations in skeletal muscle function [3, 6, 33, 37]. In the absence of weight-bearing activity, strength loss is the most evident consequence of atrophy. Moreover, showed that muscle strength decreased during bed-rest or immersion and suggested that the loss of strength [34, 36] was due primary to muscle atrophy [7, 38]. Muscle atrophy has been shown to be pronounced in the lower limb muscles [40], and it has of ten been observed that the reduction of strength is greater than that of muscle size [40, 53]. Therefore, these observed changes following a period of immobilization may cause changes in fascicle length.
Most skeletal muscles in humans are more or less pennated [18], in which muscle fibres are arranged at an angle with respect to the line of action of the muscle. The angle of muscle fibres with respect to the tendon action line is an important functional characteristic of the muscle. A large pennation angle allows more contractile material to be placed along the tendon increasing the muscle's force generating capacity, results in a less efficient force transmission through the tendon and results in a reduced fibre length, compromising shortening velocity and excursion range [12]. Pennation angle changes proportionally as a function of isometric contraction intensity.
Muscle architecture, i.e. geometrical arrangement of fibres within a muscle, has been shown to have a substantial influence on the force-generating capabilities of the muscle [29]. This angulation (pennation angle) has been shown to affect force transmission from muscle fibres to tendon, and hence muscle force generation [18, 29]. The architecture of a skeletal muscle is an important determinant of its functional characteristics [18]. Human muscle architecture may be studied noninvasively in vivo both at rest and during muscle contraction, by using real-time ultrasonography [29]. Indeed, several investigators [10] have demonstrated that during isometric contractions muscle architecture undergoes remarkable changes. Changes in fiber length by contraction are thus expressed as fascicle length changes.
In an attempt to improve our understanding of in vivo changes of muscle architecture, modern imaging techniques have been used [10, 29, 41]. Real-time ultrasonography enables in vivo muscle scanning and offers promise for a realistic determination of changes in muscle architecture [29]. Real-time ultrasonic (US) measurements were taken in the present study in the triceps surae (TS) muscle in healthy man and patients. In this report, we have studied by means of ultrasonography the relationships between architectural parameters [lengths fascicles (L), and pennation angles (Θ) of fascicles, and muscle thickness (H)] and level of force exerted in highly-subjects and patient with consequences of cerebral palsy.
The study of muscle architecture in humans of the utmost functional importance since allows the assessment of the relationship between the structure of muscle and their function, i.e. the assessment of the degree of adaptation of the muscle apparatus to an either increased or decreased functional load [10, 44, 52], without resorting to painful procedures such as muscle biopsy.
We undertook this study to determine whether ultrasound imaging could provide quantitative data about changes in muscle configuration that would distinguish pathologic from normal muscle and to determine how ultrasound measures. The purpose of this ultrasound study was establish normal values of pennation angle, and fibre length, and thickness in each muscle of the triceps surae complex [gastrocnemius medialis (GM), gastrocnemius lateralis (GL) and soleus (SOL)], and to assess the diagnostic specificity in the patient groups and a control group at rest and moment produced voluntarily during an isometric ankle plantarflexion. We employed real-time ultrasonography to visualize fascicles in vivo.
Preliminary findings have been reported previously [37].
METHODS
All subjects were volunteers and provided written informed consent to participate, prior to the experiment. The study was conducted according with the principles of the 1964 Declaration of Helsinki, and approval for the project was obtained from the local Committee of Human Research. The investigations were carried out at Clinical Hospital N 1 of Department of General Affairs of the Present of the Russian Federation.
Subjects.
Thirty subjects participated in this study. These subjects were assigned to two groups. The first group of subjects consisted of 8 healthy men (avg. age = 52 ± 3.6 years) with normal physical development and no signs of skeletal or muscular disorders. The locomotor regimen of the subjects did not deviate from the usual pattern, and their physical, nervous, and mental development was normal. The second group of subjects was composed of 22 patients men and women (avg. age = 55 ± 3.4 years) with locomotor function disorders of different etiologied related to long immobility caused by limb immobilization during postoperative and posttraumatic periods or long bed rest due to an acute cerebrovascular circulation disorder and its consequences, as well as with obliterating atherosclerosis of the lower limb vessels (weak legs), the aftereffects of infantile cerebral palsy, ischemic myelopathy, radiculopathy associated with spinal diseases (osteochondrosis), and musculotonic disorders.
Torque measurements.
Subjects lay in the supine position on the bench a isokinetic dynamometer («Cybex®II», USA) with the right knee joint securely fixed at an angle of 60 ° to prevent movement of the tibia with respect to the center of rotation of the talocrural joint. The right foot was tightly strapped to a footplate of the isokinetic dynamometer right leg with two straps with the foot positioned at 90 ° relative to а footplate.
Subjects performed a series а standard warm-up and three to five submaximal of isometric plantarflexion contractions on an isokinetic dynamometer at ankle angles of 0 ° (neutral anatomic position: the footplate of the dynamometer perpendicular to the longitudinal axis of the tibia). Subjects performed of the plantar flexors following instructions to "push down as if you were pressing a gas pedal, increase force to a maximum" with the subsequent measurement of the maximal torque moment (maximum voluntary contraction ¾ MVC). Each subject performed between two and four MVCs. There was a 1-min rest between the set. In each set, the contractions were performed at a rate of 0.5 × s-1. Subjects were given visual feedback of the target and elicited force on a computer screen. The MVC was determined as the highest value of voluntary force recorded during the entire contraction.
Ultrasound scanning.
Fascicular lengths and pennation angles of human TS were measured in vivo from sonographs taken during rest (passive) and active conditions. A real-time B‑mode ultrasound apparatus («Sonoline Elegra», Siemens, Germany) with a 7·5 MHz linear-array probe, and length of a scanning surface 80 mm and thickness of 10 mm was used to obtain sagittal images of the triceps surae muscle (Fig. 1). Longitudinal ultrasonic images of the triceps surae [medial (MG) and lateral (LG) gastrocnemius and soleus (SOL) muscles] were obtained (Fig. 1) at the proximal levels 30 % (MG and LG) and 50 % (SOL) of the distance between the popliteal crease and the center of the lateral malleolus. Images were recorded at 50 % shin length (90 ° flexion at the hip and knee joint), according to procedures previously described [16, 44]. The marker was a 1.5-mm copper wire encased in a soft plastic material and placed on the surface along the lower leg circumference at a fixed distance (Fig. 1). The axially oriented transducer was placed perpendicularly to the muscle examined to ensure close contact and was transposed from the central to the lateral position along the marker placed on the muscle surface. During scanning, the pressure of the transducer on the skin was minimized to prevent muscle compression.
Each level is where the anatomic cross-sectional area of the respective muscle is maximal [15]. At that level, mediolateral widths of MG and LG were determined over the skin surface, and the position of one-half of the width was used as a measurement site for each muscle. For SOL, the position of the greatest thickness in the lateral half of the muscle was measured at the level mentioned above. Figure 2 shows the calf with planes of ultrasonograms for the two muscles. The echoes from interspaces of fascicles and from the superficial and deep aponeuroses were visualized [39]. By visualizing the fascicles along their lengths from the superficial to the deep aponeuroses, one can be convinced that the plane of the ultrasonogram is parallel to the fascicles [29]; otherwise, the fascicle length would be overestimated and the fascicle angle would be underestimated [52]. The echoes from interspaces of the fascicles were sometimes imaged more clearly along the length of fascicles when the plane was changed slightly diagonally to the longitudinal line of each muscle. The fascicles were somewhat curvilinear in all muscles (particularly MG) at shorter lengths. The length of a fascicle was always measured along its path, with the curvature, if present, taken into consideration. For the fascicle angle, a line was drawn tangentially to the fascicle at the contacting point onto the aponeurosis. The angle made by the line and aponeurosis was measured as the fascicle angle. Some authors have approximated a fascicle as a straight line between its origin and insertion to determine fascicle angles [23]. The probe was coated with, а water-soluble transmission gel to provide acoustic contact without depressing the dermal surface.
A real-time B-mode US apparatus («Sonoline Elegra», Siemens, Germany) with a 7.5-MHz linear-array probe was used to obtain sagittal images of the GM, GL and SOL, at rest and at 50 % of plantarflexor MVC at the neutral ankle position. A transducer with a 7.5-MHz scanning head was placed perpendicular to the tissue interface. The scanning head was coated with water-soluble transmission gel, which provided acoustic contact without depressing the dermal surface. The subcutaneous adipose tissue-muscle interface and the muscle-bone interface were identified from the ultrasonic image, and the distance from the adipose tissue-muscle interface to the muscle-bone interface was adopted as representative of muscle thickness. All measurements were performed on the right leg. During all measurements, subjects were instructed to relax their leg muscles.
Joint position settings and ultrasound scanning.
Each subject's right foot was firmly attached to an isokinetic dynamometer, and the lower leg was fixed to a test bench. The ankle joint was fixed at 0 ° (neutral anatomic position). In these conditions, the subject was asked to relax the plantar flexor muscles (passive condition), and passive plantar flexion torque was recorded from the output of the dynamometer by a computer.
After performance in the passive condition, the subject was perform measurement 50 % of the MVC (static contractions; active condition) was calculated for neutral ankle position (0 °), and they were encouraged to hold contraction for about 2-3 s.
In each position (passive and active conditions), longitudinal ultrasonic images of the triceps surae [medial (MG), and lateral (LG) gastrocnemius, and soleus (SOL) muscles] were obtained.
Muscle fibre pennation angle.
The fascicle pennation angle ( Θ ) was measured from the angles between the echo of the deep aponeurosis of each muscle and interspaces among the fascicles of that muscle (Fig. 1) [10, 29].
Determination of fascicle length.
The length of fascicles ( L ) across the deep and superficial aponeurosis was measured as a straight line between the insertion points of the fascicle, onto the aponeurosis of the muscle [1, 39].
Measurement of muscle thickness.
The distance between aponeuroses (muscle thickness) was estimated from the fascicle length and pennation angle using the following equation:
Muscle thickness = L × sin α,
where L, and α is the pennation angle of each muscle determined by ultrasound.
In the present study, ultrasonic measurement was repeated three times for each individual and averaged values were used. The coefficients of variation of three measurements were in the range of 0-2 %. All ultrasonic images were processed with use of the software package «Dr. ReallyVision» (Ltd. «Alliance - Holding», Russia).
Determination of muscle fiber shortening.
Аn indication of the internal muscle fiber shortening (Δ L muscle) during muscle contraction mау be the difference between the fiber L and the inclination L and Θ in the active compared to the passive state of the muscle [16]. The degree of the muscle fiber shortening Δ Lmuscle was determined using the formula, i.e.
Δ Lmuscle = Lp × cos Θp - La × cos Θa,
where Lp, and La аге fascicle lengths in passive (rest) and active condition (50 % MVC), and Θp and Θa are fascicle lengths in passive and active condition, respectively.
Statistical methods.
Data are presented as the mean values ± standard error of the mean (SE). Differences in pennation angles, fibre lengths and thicknesses between rest and 50 % MVC and between different ankle angles were tested using two-way analysis of variance tests. Tukey's test was used to determine significant differenced between mean values. One-way analysis of variance (ANOVA) was used for comparison of muscle thickness, pennation angles, and fibre lengths. A level of p < 0.05 was selected to indicate statistical significance.
RESULTS
Figure 3 shows average L and Θ of MG, LG, and SOL. The US findings in the patient groups were compared to of a control group. From the US image, it was observed that L and Θ changed during in the passive condition and specially the active condition. The degree of L change was not identical for the three muscles The effects relaxation and an isometric contraction of the triceps surae muscle (50 % MVC) on L were significant for MG and LG (Table) and there was also a significant interaction between control and patients in these muscles
(Fig. 3, top). In other words, in MG and LG, changes in L changes were larger with the SOL. In the active condition, L of MG was not different between control and patients, although in the passive condition the difference was significant. The L of SOL was not different.
From the US image, it was observed that and Θ changed during an isometric contraction of the TS muscle. Changes in L, and were expressed as a function of relative torque. The Θ change was not identical for the three muscles. The fascicle Θ of MG demonstrated the greatest variation in three muscles (Fig. 3, top). The effects of activation and relaxation positions were significant in all three muscles. The differences in MG fascicle Θ because of changes in ankle positions were significant among control and patients both in the passive and active conditions. Fascicle Θ of LG and SOL not differed among control and patient in the relaxation condition but not in the activation condition. For LG, and SOL fascicle Θ were changes were larger in control with the patients. The mean values fascicle Θ of MG, LG, and SOL an isometric contraction (50 % MVC) in the control groups increased by 60, 41, and 41 %, respectively; in the patient groups were a smaller increase, by 28, 26, and 36 %, respectively.
H of MG and LG were not significantly greater in control than in patients, but in SOL were loss than in control (Fig. 4). Changes in H were expressed as a function of relative torque. H of MG at was no significantly different between rest and 50 % MVC. In contrast, H of LG and SOL increased from rest to MVC by 21.9 % (p < 0.05) and 17.9 % (p < 0.05), respectively. In MG and SOL patients was not significantly different either between different imaged. H LG and SOL were not significantly greater in patients by 10.7 % and 3.6 %, respectively, but MG was decreased by 3.6 %.
In the group of healthy subjects, Δ Lmuscle was 11.6 ± 1.8 mm (from 8.4 to 17.8 mm) for MG, 9.8 ± 1.9 mm (from 2.3 to 12.8 mm) for LG, 6.5 ± 1.4 mm (from 3.0 to 10.0 mm) for SOL. In the group of patients, this parameter was invariably less by 20.5 % (from 1.9 to 11.1 mm), 37.5 % (from 0.9 to 9.6 mm), and 24.6 % (from 3.4 to 5.9 mm), respectively (Fig. 5). The Δ Lmuscle (averaged for MG, LG, and SOL) was significantly higher in group of healthy subjects and correlated with the plantar flexion torque (isometric MVC).
DISCUSSION
The main results of this study are the following, first, we found that the MG, LG, and SOL architecture (L and Θ) in humans substantially changes in vivo as a function of the ankle joint angle in the passive state; second, this study was the first to describe quantitatively the relationship between the architecture of different TS heads in the active state (50 % of the MVC) with a constant (predetermined) articular angle; and third, it was also the first to describe the MG, LG, and SOL architecture in healthy subjects as compared to patients with locomotor function disorders in vivo at rest (in the passive state) and during graded isometric contraction (the active state) using ultrasonic scanning.
As shown in this study, the architectural characteristics of the MG, LG, and SOL differ in healthy subjects and patients with locomotor disorders both at rest (the passive state) and when making an isometric effort (50 % of the MVC). In the passive state, the MG fiber L and, especially, the LG fiber L were greater in patients than in the group of healthy subjects, whereas no differences were observed in the SOL muscle. Upon the transition to the active state, ambiguous changes in the MG, LG, and SOL fiber L were observed. In the group of patients, the MG and LG fiber L decreased by 28 and 14 %, and in the group of healthy subjects, it decreased by 31 and 24 %, respectively, but it did not differ in SOL (Fig. 3a). Moreover, the fiber L was shorter and the pen-nation Θ was greater in the active state compared to the passive state. In the group of healthy subjects, the fiber L shortening in the MG, LG, and SOL was accompanied by an increase in the fiber pennation Θ by 60, 41, and 41 %; in the patients, by an increase by 28, 26, and 36 %, respectively (Fig. 3b). This is confirmed by data obtained earlier in study of other human muscles [23, 32, 33].
In the group of healthy subjects, the MG fiber pennation Θ in the active state was significantly greater compared to the LG and SOL, whereas, in the group of patients, this parameter was higher in the SOL (Fig. 3b). The differences between the parameters in the passive and active states of the muscle were greater in healthy subjects compared to patients with locomotor function disorders. This allows the suggestion that the pattern observed was determined by the low tension developed by the weak musculotendinous complex [26]. This suggestion is supported by the 160% increase in the MG fiber pennation Θ in healthy subjects on switching from the passive to the active state, which agrees with the data from [24]. The weakness of muscles in the passive state poses problems in the system of control of voluntary movements. Weak muscles might shorten by a lesser L than their optimal L before their tendon becomes sufficiently stretched to be able to withstand a greater tension: at these lengths, the force-producing capabilities of the fibers are impaired. It was shown earlier that intrafusal muscle fibers could become weak even at physiological lengths, which influences the ability of the muscle spindles to act as length transformers [8]. The weakness of extrafusal muscle spindles also decreases the sensitivity of transducers to changes in the muscle spindle L and, consequently, decreases the reflex role of the proprioceptive pathways of the afferent fibers [21].
The force-producing capabilities of muscles are influenced to a greater degree by differences in muscle architecture than in fiber composition [5]. The fiber L and the muscle H determine not only the force of contraction [46, 49], but also the degree of the muscle motion when it develops force. The force generated by muscle contraction depends on [57], in addition to the composition, the fiber pennation Θ, which allows the muscle to produce a higher force per gram of muscle mass [46]. The differences in the maximum force and velocity of shortening between the MG and LG are predominantly determined by their architectural characteristics [25, 30] because the LG fibers are longer than those of the MG and SOL. This suggests that the LG has the greatest number of sarcomeres and, taking into account that the composition of fibers in the MG and LG is the same [28], the greater L of the LG fibers imparts a higher velocity potential to the muscle [25]. At the same time, the MG is characterized by a shorter fiber L and a greater pennation Θ and, consequently, has a higher capacity for generating a greater force. This agrees with data that the MG cross-sectional area is 2.5 times greater that of the LG, whereas their volume differs only by a factor of 1.7 [16]. The maximum fiber shortening velocity is also determined by the composition of the fibers making up the muscle [5], but, since the MG, LG, and SOL fiber composition is the same on average [46], the maximum shortening velocity and the maximum force of contraction developed by the muscle are predominantly determined by their architectural characteristics [5].
Smaller changes in the MG and LG fiber L in patients with locomotor function disorders upon the transition from rest to the active state may have resulted from the insignificant increase in the fiber pennation Θ in these muscles, which increases tendon deviations in relation to changes in the fiber L [19] and decreases the fiber stiffness and the capacity for tendon lengthening due to the decreased strength of muscle contraction. Simultaneously, with lesser changes in the SOL fiber L, a considerable increase in the fiber pennation Θ occurs. As a result, there are fewer differences between the passive and active states of the muscle, and, hence, DLmuscle decreases. It was found that, with the knee joint set at approximately 90°, the LG fiber L in patients with locomotor function disorders changed to a lesser degree during isometric contraction (the active state) compared to the MG muscle. In this position, the MG fiber pennation Θ was approximately ~ 30 °. Since the force of the muscle fibers is transmitted to the tendon with a correction for the coefficient of fiber pennation Θ cosine [15], the coefficient for the MG in this position is approximately 0.9; i.e., virtually all the force developed by the fibers is transmitted to the tendon. Therefore, in this position, the contribution of the MG to the total strength of the Achilles tendon will be much greater.
The change in DLmuscle corresponds to the value of the tendon movement which results from lengthening of the tendon tissue (tendon and aponeurosis) during muscle contraction [25]. The averaged DLmuscle reflects the value of the force developed: a greater DLmuscle results from a greater force of contraction. Since the DLmuscle value is higher when the muscle fiber is longer, this suggests that the force developed by the muscle will be greater in a muscle with longer fibers. However, it is impossible to quantitatively assess the force by the DLmuscle parameter because this relation depends on many factors, in particular, the tendon compliance, its total length, and the length of sarcomeres. However, the tendency for DLmuscle to increase with an increase in the muscle fiber L (Fig. 4) allows the suggestion that the muscle strength will increase with an increase in the fiber L: the maximum DLmuscle of the MG muscle was the highest among the three muscle heads. Influenced by the angular structure, DLmuscle will change, especially in a muscle with shorter fibers, because the force developed by these fibers toward the tendon will be less when the fiber L is shorter. A lesser DLmuscle value of each TS head in the group of patients with locomotor function disorders allows the suggestion that, during locomotion and other routine activities, the MG, LG, and SOL work with smaller changes in the fiber L for the force to be developed more effectively (Fig. 3a).
Patients with locomotor function disorders perform very few quick vigorous movements in their daily routine activities, and, accordingly, this does not involve the activity of type II quick fibers, developing a great force of contraction [42]. The muscle atrophy associated with long disuse of the muscle apparatus is usually linked to reduction in the muscle and muscle fiber masses [42] and especially the size of type II fibers [42] and the muscle cross-sectional area (or volume) [47]. However, since most human muscles are pinnate [9], it is more correct, when the phenomenon of atrophy is interpreted, to consider changes in the internal muscle organization, i.e., to take into account the muscle architecture.
In our study, ultrasonic scanning of the MG, LG, and SOL in the group of healthy subjects and patients with locomotor function disorders revealed substantial changes in the muscle architecture. Ultrasonic imaging shows that disuse causes significant changes in the internal architecture of the MG, LG, and SOL muscles. In the group of patients with functional disorders of the locomotor apparatus, a decrease in the fiber L and pennation Θ was found, which is supported by data obtained earlier [45]. Shortening of the muscle fiber L suggests loss of sarcomeres arranged not only in series, but also in parallel [48, 51]. The functional aftereffect of a shortened muscle fiber L may be a lower level of generation of the force of muscle contraction by patients with motor disorders; a decrease in the absolute number of sarcomeres arranged in series facilitates a decrease in the maximum shortening of the whole fiber. The smaller fiber pennation Θ during muscle contraction in the group of patients with locomotor function disorders suggests that this, in part, makes up for the loss of strength by a more efficient transmission of the force developed by the fiber to the tendon to which it is attached.
CONCLUSIONS
The study was designed to look into the possibilities of using, in the real-time mode, the method of ultrasonic scanning of human skeletal muscle for obtaining quantitative data on their architecture. Our study showed that real-time ultrasound was indeed useful in quantifying configurational differences between the relaxed and contracted state of the TS between in the patient groups and of a control group. Gans and Bock [18] indicate that, in the transition of muscle from rest to contraction, changes occur. Shortening of muscles that occurs during contraction is associated with a shift in rotation of tendons and an increase in muscle thickness [59].
The results of this study show that the muscle architectures of different TS heads differ significantly, reflecting their functional role in the diversity of movements. The method of ultrasonic scanning enables us to observe, in the real-time mode, the movements of human muscle fibers in vivo and to measure directly the changes in the pennation angle Θ and the length L of muscle fibers during contraction.
The results obtained show that the architecture of actively contracting muscle fibers differs considerably from the muscle architecture at rest (the passive state). Thus, ultrasonic scanning of muscles is a highly informative and available method for assessing the architecture of skeletal muscles in humans and may be used in combination with other methods for assessing their functional state and studying the mechanisms determining its changes influenced by different factors. Comparative study of muscle architecture in patients with different motor disorders is important for understanding the processes occurring in healthy subjects influenced by the action of different factors, including microgravity and sports training; in different diseases; and in the performance of therapeutic and rehabilitation procedures.
Our results show that the US image method applied is valid and reliable for assessing the size of a large, individual, human locomotor muscle. This method can provide information on cross-sectional area changes along the entire muscle length in response to training, disuse or as a spaceflights. This study proved that ultrasonography can be used to identify atrophy and changes in of the peripheral muscle system.
Internal architecture of the TS complex was altered. Both fascicle length and pennation angle were reduced after in patients groups, this strongly suggests a loss of both in-series and in-parallel sarcomeres, respectively. This observation is in agreement with previous findings in disuse conditions [22]. The functional consequence of the decreased fascicle length was a reduced shortening during contraction. It is necessary to note, that at some patients with motor disorders, having restriction of mobility, the normal ultrasonic architecture of muscles was marked. It is possible to assume, that disuse of a muscle is not the unique factor influencing on the ultrasonic architecture of muscles. Studying of architecture of muscles at patients with various
motor disorders allows to understand better the intimate processes in healthy persons under influence of various factors, including microgravitation, long space flights, where restriction of impellent activity takes place, despite of using preventive measures, and experiments on animals demonstrate the development of a muscular atrophy in conditions of microgravitation.
ACKNOWLEDGEMENTS
The authors thank N. Vit'ko, M.D., Ph.D., Dr.Sci. (Director of Clinical Hospital № 1 President Medical Center), and also thank Dr. I. Berezhinskiy, Ph.D. for development of the software (Head of Moscow Ltd. «Alliance - Holding»).
Finally, the author thank of all volunteers who participated in this study.
Legends to Figures
Figure 1
Experimental set-up.
Position of the subject on the isokinetic dynamometer. 1, actuator; 2, dynamometer footplate; 3, ankle joint axis aligned with the point of the dynamometer; 4, marker of movement of the ultrasonic probe; 5, velcro straps; 6, ultrasound system; 7, B-mode ultrasound probe secured in position.
Position of probe and leg during compound scanning MG (left panel) and LG (right panel).
Figure 2.
Typical sagittal TS sonographis at rest. Ultrasonic images representing the medial (MG) and lateral (LG) gastrocnemius muscles. While lines in the longitudinal image indicate echoes from the deep aponeurosis (APN) and the interspace between fascicles (AT-M subcutaneous adipose tissue-muscle. I-M intermuscular, Θ - fascicle pennation angle). Fascicle length ( L ) was determined as length of echoes from fascicles. Θ were defined as angles at which fascicles arose from deep (MG) and superficial (LG) aponeurosis
Figure 3.
Architectural parameters of MG, and LG, and SOL at rest and during graded isometric contraction in control subjects and patient groups
Figure 4.
Thickness of the MG, LG, and SOL at rest and during isometric effort (50 % MVC) with the ankle joint angle in the neutral position in control subjects and patient groups
Figure 5.
Internal shortening (Δ Lmuscle) of fascicle MG, LG, and SOL with the ankle joint angle in neural position
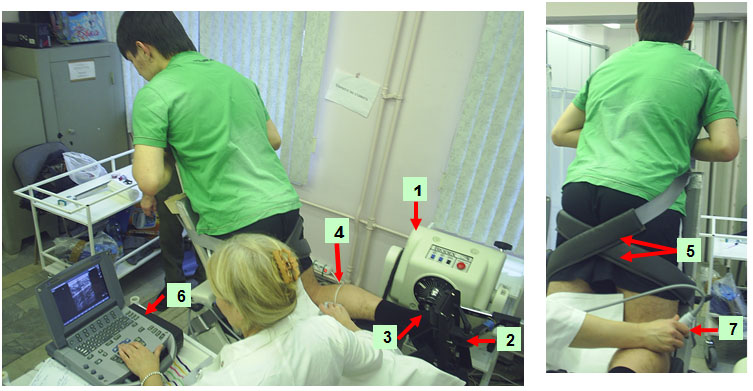
Fig. 1
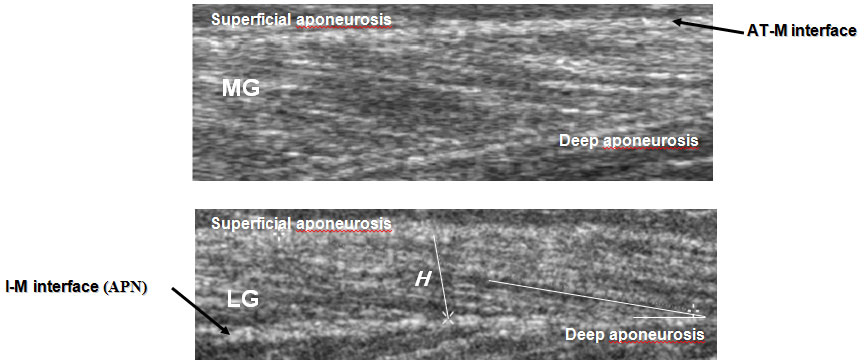
Fig. 2
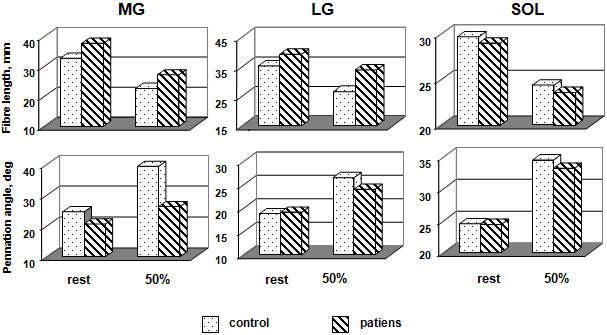
Fig. 3
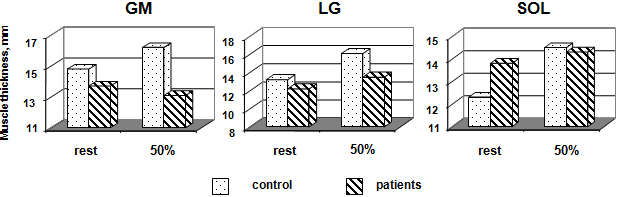
Fig. 4
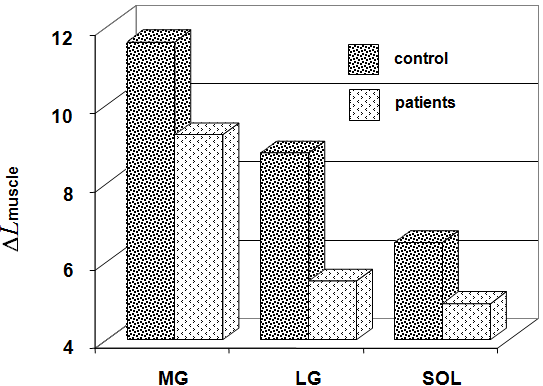
Fig. 5
Table Percentage difference between pennation angle, and fibre length, and thickness of a control subject and patient groups of human triceps surae muscles (effort 50 % MVC)
|
|
Fibre length, (L) |
Pennation angle, (Θ) |
Thickness, (H) |
|
Medial Gastrocnemius |
|||
|
control subjects |
-30.6 |
60.2 |
9.4 |
|
patients |
-27.9 |
27.7 |
-4.4 |
|
Lateral Gastrocnemius |
|||
|
control subjects |
-24.4 |
40.9 |
21.9 |
|
patients |
-13.5 |
25.7 |
10.7 |
|
Soleus |
|||
|
control subjects |
-17.8 |
40.8 |
17.9 |
|
patients |
-18.6 |
36.1 |
3.6 |
Yu.A. Koryak, M.M. Kuzmina STRUCTURAL AND FUNCTIONAL VALUE OF ARCHITECTURE IN SPASTIC SKELETAL OF THE HUMAN MUSCLE (According to ultrasonic scanning). International Journal Of Applied And Fundamental Research. – 2013. – № 1 –
URL: www.science-sd.com/452-24060 (24.07.2026).